How to monitor a Web Service
You can monitor Web Services by creating HTTP monitors. We send HTTP requests to the target API endpoint and wait for a response from the server.
Then, we match the HTTP status code returned by the server against the allowed ones. You can customize the request by choosing the HTTP method (HEAD, POST, PUT, DELETE & OPTIONS).
PUT and POST requests can also specify a payload in the request body as JSON, XML, or URL encoded. You can use Basic authentication on HTTP requests and supply custom headers for things like Bearer authentication.
Web Application Availability Monitoring
Create an HTTP Monitor to track its uptime percentage in the last 24 hours, seven days, and 30 days time period. We track these values in three-digit decimal precision. A downtime of just 26 seconds will decrease the 30-day uptime from 100% to 99.999%.
From the Monitors area, you can see the 30-day uptime of all monitors as a percentage. A graph shows all events that happened in the last 24 hour period. The Overall Uptime lists the average uptime in your account, across all monitors. You can see the latest downtime event in the top right of the Monitor dashboard.
Clicking on a monitor will show its uptime statistics such as:
-
Since when the Monitor has been Up (it's uptime)
-
The Uptime percentage in the last 24 hours, seven days, and 30 days
-
When the latest downtime happened
Common Use Cases
Monitor the functionality, uptime, and performance of your Web APIs

Web API monitoring
Call web APIs using SOAP, REST, JSON & XML over the HTTP protocol. Track the status code, monitor the response time, and validate the response content.
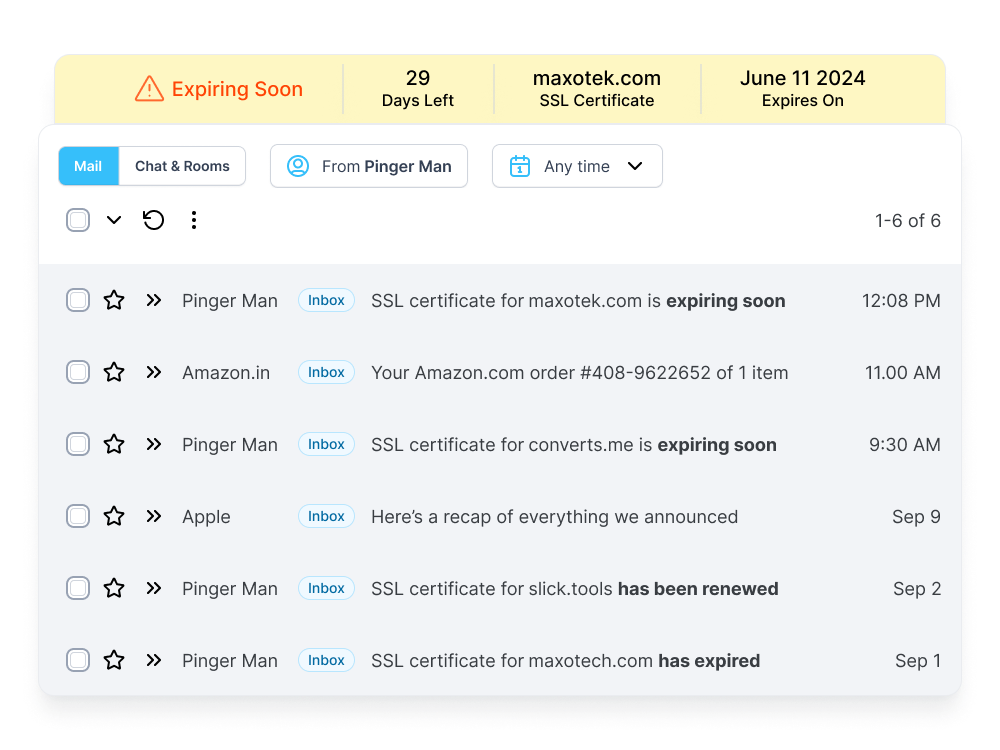
SSL certificate monitoring
Never let your SSL certificates expire with Pinger Man's timely notification, days before expiry.
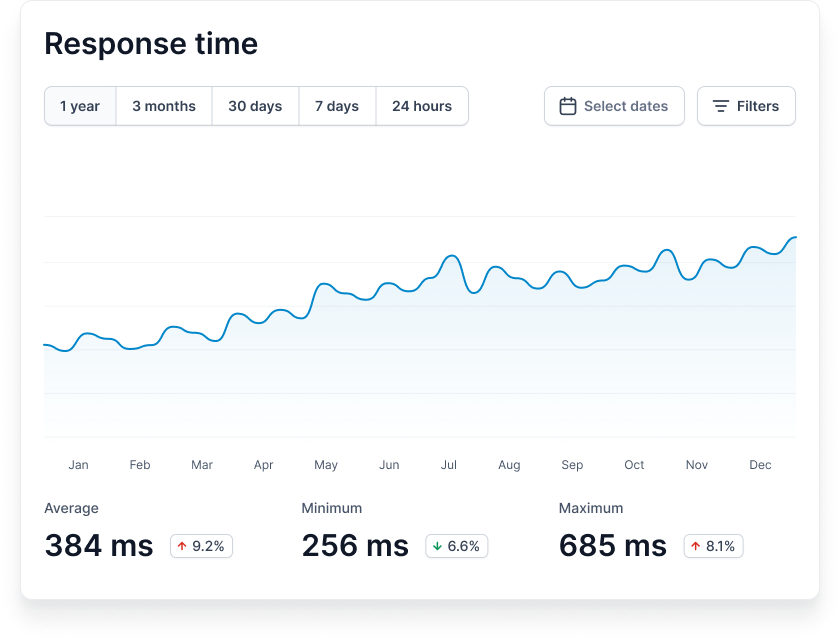
Response time monitoring
Our performance monitoring tool keeps track of the API response time and sends real-time alerts when the performance degrades. We continuously monitor your web application to find performance issues. The dashboard shows all the performance data we have collected.